FILTER
FILTER is a package to analyse the operation of any filter which can be used to analyse and optimise cartridge and moulded filters, bag filters, ESP's etc. The salient features of FILTER are:
It can be used in both the cases of feed-product monitoring (as with cartridge and moulded filters) and feed-collection monitoring (as with bag filters and ESP's).
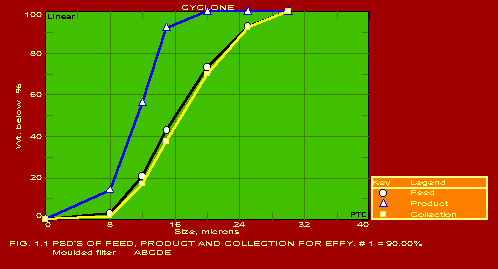
It determines the complete performance characteristics of a filter from a measurement of the particle size distributions (psd) of the dust fed into the filter and either the dust that comes out (feed-product monitoring problem) or the dust that is collected by the filter (feed-collection monitoring problem). However, wherever feasible, it is advisable to monitor both the product and collected dusts.
It determines the psd of the dust that is collected (in feed-product monitoring problem) and the effluent dust (in feed-collection monitoring problem).
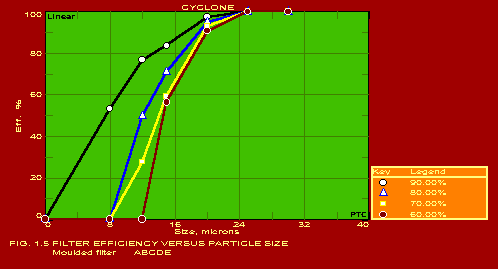
It calculates the filter efficiency curve, which is a plot of collection efficiency versus particle size.
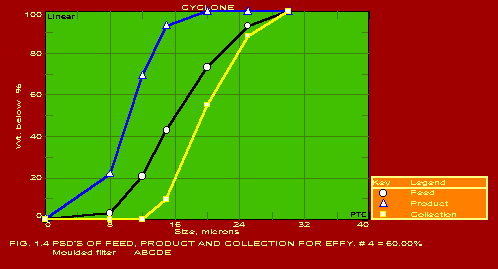
The psds of feed, product and collected dust are displayed in a single graph.
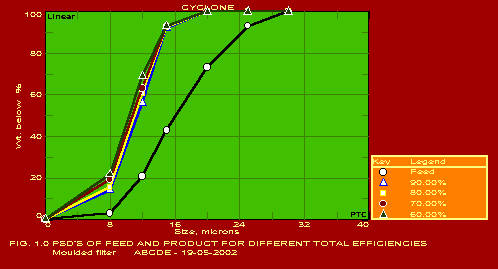
The psds of feed and product at different total efficiencies are displayed in a single graph.
The basic input data required for FILTER are the psds of feed and product dusts. These can be effectively monitored using a simple microscope and their psds can then be obtained using our software SIZEANAL. The psds can also be obtained using any one of the several other particle size measurement instruments available in conjunction with SIZEANAL.
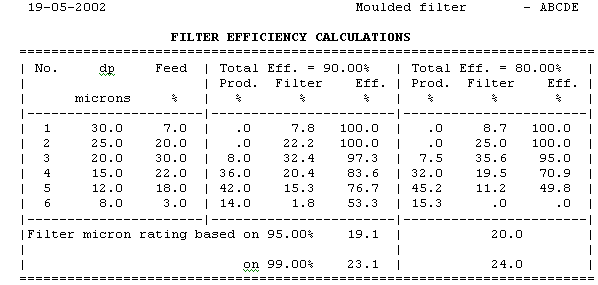
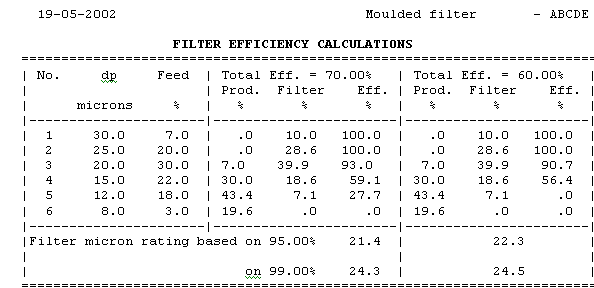
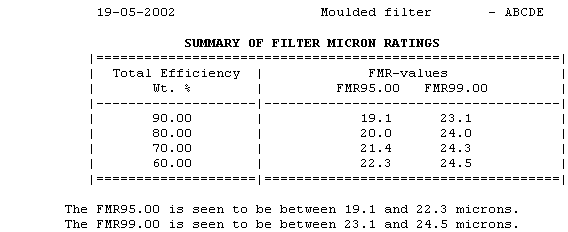
For the same feed dust psd, a filter can be operated at different total efficiencies (or at different flow rates). A smaller flow rate would lead to a larger residence time inside the filter thereby yielding a higher total efficiency. The package FILTER can simultaneously analyse the performance data of up to a maximum of four different total efficiencies. At any one value of total efficiency, larger particles would have a greater probability of being captured by the filter. Thus, for one total efficiency, there would be a filter efficiency curve representing the fraction of feed of ith size getting collected by the filter versus the feed size itself. The Filter Micron Rating (FMR) is defined as that particle size for which the collection efficiency equals a specified value. FMR95, FMR99, FMR99.9 etc. refer to the FMR-values corresponding to collection efficiencies of 95, 99, 99.9% respectively. These values, in turn, are back-calculated from the filter efficiency curve obtained above. Thus it is essential to understand that the same filter can have different filter micron ratings for different total efficiencies and different reference collection efficiencies.
The package FILTER calculates and prints FMR-values at any desired efficiency levels.
The integrated graphics system in FILTER which is used to obtain the various psd and efficiency graphs is extremely versatile and powerful. For instance, the data can be instantly shown on linear, log-log, semi-log, Rosin-Rammler and monotonic scales. The "goal-seek" feature is especially useful to obtain the FMR-values at any desired collection efficiency with the click of a button.
The package is thus useful to evaluate the performance of and thereby achieve optimisation of any filter. It is especially useful to filter manufacturers who can precisely know the FMR-values for any design and offer the right choice of filter to any user. The package is also equally useful to filter users who can periodically monitor the filter performance which, in turn, would be helpful in deciding as to when the same is to be replaced. In this connection, the software GITA is also quite useful to correlate the pressure drop-time relationship to accurately predict the filter replacement time when the pressure drop reaches a particular value.
 |
|||||||||||||||||||||||||||||||||||||||||
 |
|||||||||||||||||||||||||||||||||||||||||
 |
|||||||||||||||||||||||||||||||||||||||||
A sample result file obtained is shown
|
|||||||||||||||||||||||||||||||||||||||||
